Nossos Serviços

Inteligência financeira e ferramentas para investidores no Brasil.

Cursos e Treinamentos

Capacitação para investidores com foco em dados e mercado financeiro brasileiro.

Several gold bars are placed on top of a pile of bitcoin coins and US dollar bills, indicating a scene of wealth and finance.
Ferramentas e Produtos

Desenvolvemos soluções que ajudam investidores a utilizar dados de forma mais eficaz e estratégica.

A person holding a smartphone displaying a financial app with charts and data, while standing near a decorated Christmas tree with glowing lights.

Inteligência Financeira

Oferecemos ferramentas e serviços para investidores no mercado financeiro.

An interior space with a high ceiling featuring a large electronic board displaying various financial data and numbers. There is modern seating with red and white chairs, and a person is walking through the room.
Educação Financeira

Capacitamos mais de 20.000 estudantes com habilidades para prosperar no mercado financeiro brasileiro.

A close-up of a printed financial newspaper or report featuring numbers and text organized in columns and rows. There is a percentage symbol placed within a red circle on a green background, possibly indicating financial data or statistics.
Ferramentas Avançadas

Desenvolvemos produtos que ajudam investidores a utilizar dados de forma eficaz.

Contato Rápido

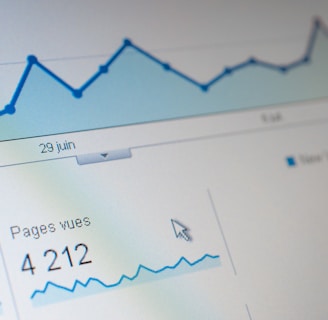
A computer screen displaying a data analytics dashboard with graphs and charts. A blue line graph shows fluctuations in data over time, and a section highlights the number of page views. A pie chart is partially visible, indicating a breakdown of different data elements.

Entre em contato conosco para saber mais sobre nossas ferramentas e serviços para investidores.